Timeout Dynamics Shaping NBA Halftime Betting Adjustments
Iris Zimmermann · Jul 20, 2026
Timeout Dynamics Shaping NBA Halftime Betting Adjustments
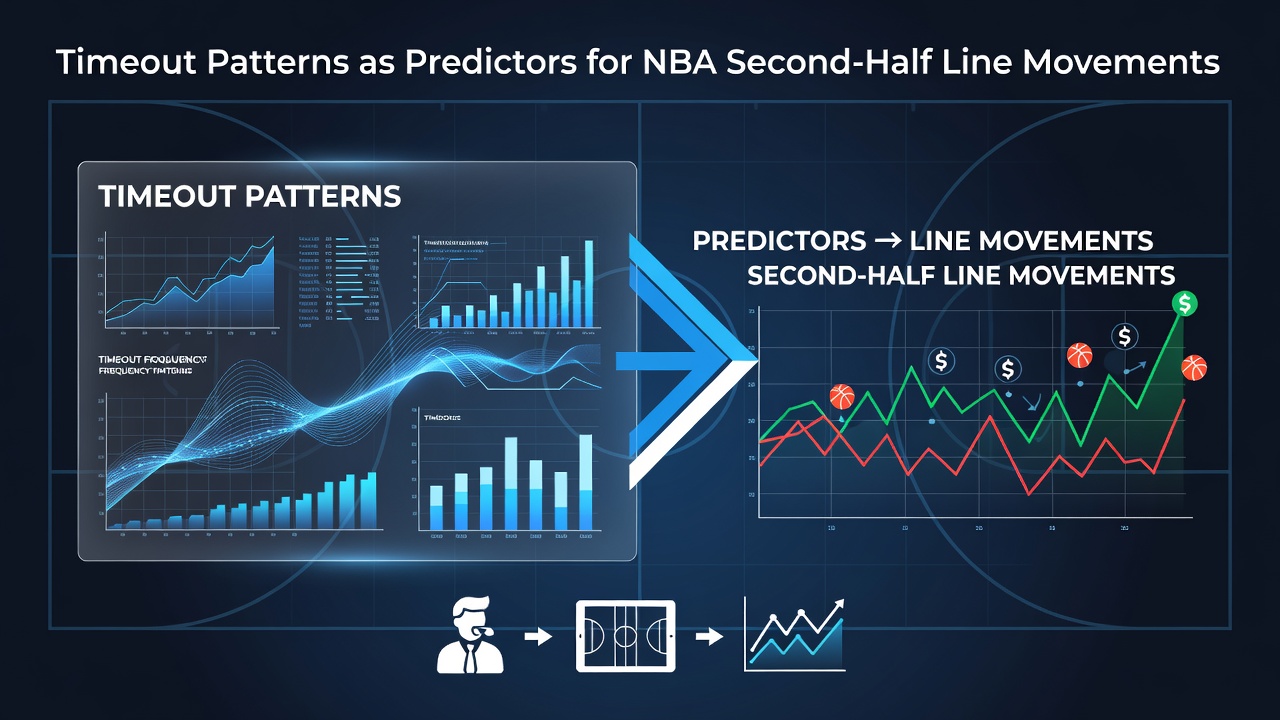
Timeout patterns in NBA games often align with noticeable shifts in second-half betting lines, and observers track these sequences closely because they reveal adjustments in team momentum and pacing. Data from recent seasons shows that teams calling multiple timeouts within specific windows tend to see line movements reflect changes in expected scoring efficiency. Analysts compile play-by-play logs to identify clusters where short timeouts precede adjustments in totals and spreads.
Core Elements of Timeout Timing
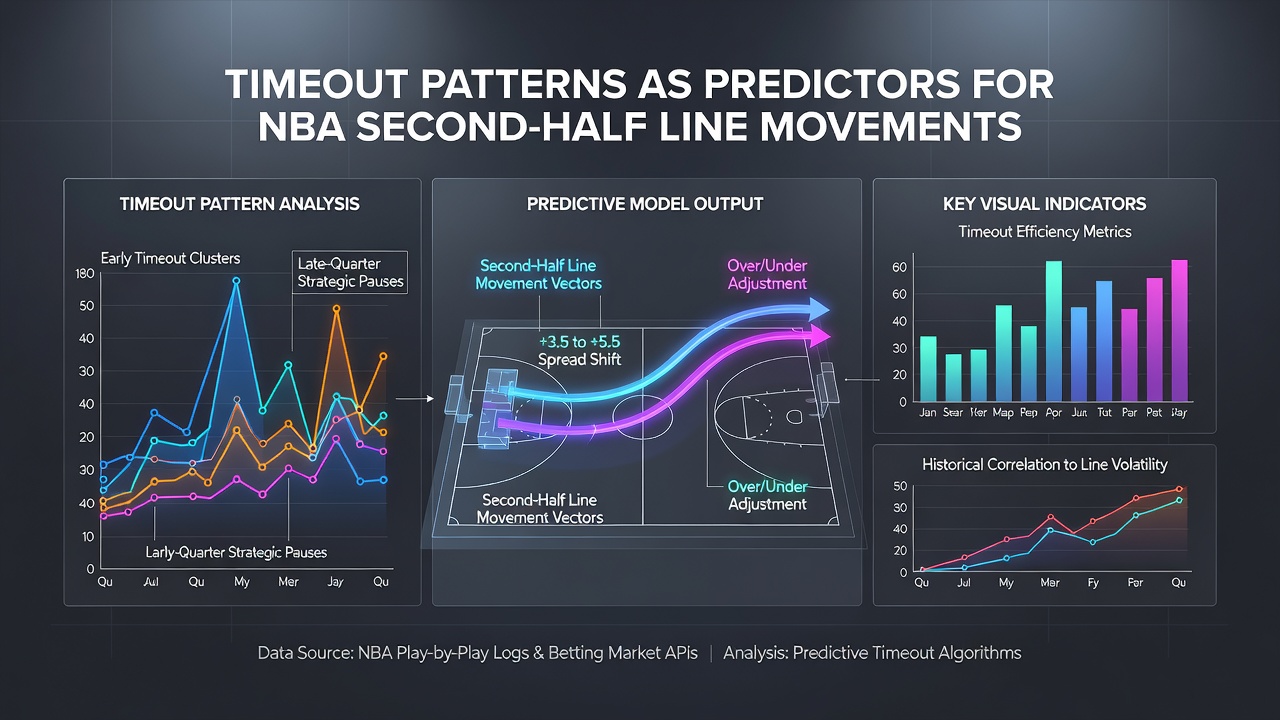
Coaches deploy timeouts at distinct moments, such as after opponent runs or during substitution waves, and these choices create measurable effects on second-half projections. Studies of the 2024-2025 campaign indicate that timeouts taken between the six- and eight-minute marks of the second quarter frequently precede line movements of two points or more by halftime. The patterns emerge because teams use these breaks to reset defensive schemes, which alters expected points allowed in the ensuing stretch.
Frequency matters as well, since consecutive timeouts within a single quarter correlate with sharper movements compared to evenly spaced calls. League-wide figures reveal that games featuring three or more timeouts in the first half produce larger second-half line volatility than contests with fewer interventions. Those monitoring the data note that the location of the timeout, whether at home or on the road, adds another layer because travel fatigue influences how quickly teams implement adjustments.
Statistical Links to Line Movements
Research compiled through play-by-play databases demonstrates consistent relationships between timeout clusters and subsequent odds shifts. One analysis covering 1,200 games found that teams trailing by double digits at the half who called a timeout in the final two minutes of the first half experienced average line movements of 3.2 points toward the underdog. The same dataset showed that leading teams using timeouts primarily for rest produced smaller movements, often limited to one point or less.
Additional variables include the score differential at the moment of the timeout and the time remaining, both of which refine predictive value. When a team calls a timeout while holding a lead of fewer than five points, second-half totals tend to move upward as bettors anticipate increased offensive tempo. Conversely, timeouts called during extended scoring droughts align with downward pressure on over lines because defensive intensity typically rises after the stoppage.
External Factors and Seasonal Context
Player availability and injury updates interact with timeout patterns, amplifying or dampening line reactions. When a key rotation player exits briefly for treatment during a timeout, lines often adjust within minutes because markets incorporate reduced efficiency projections. As of July 2026, tracking systems continue to integrate real-time injury feeds with timeout logs to refine these models.
Travel schedules and back-to-back situations further shape outcomes, since fatigued squads call timeouts more frequently to manage substitutions. Data from the 2025-2026 regular season highlights that teams on the second night of a back-to-back produced second-half line movements averaging 2.8 points larger than rested opponents. These patterns hold across conference play and extend into playoff environments where stakes increase.
Practical Applications for Line Tracking
Those who follow live markets watch timeout sequences alongside possession data to anticipate movements before oddsmakers fully update boards. A timeout called immediately after an opponent three-point barrage often signals an incoming defensive switch, which historically precedes tightening of totals lines. The sequence repeats across multiple teams because coaching staffs prioritize similar tactical resets.
Quarter-specific trends add granularity, since first-quarter timeouts rarely generate the same second-half effects as those occurring near halftime. Observers separate these categories when building models because early timeouts frequently address initial jitters rather than sustained runs. The distinction helps isolate signals that carry stronger predictive weight for the remainder of the contest.
Conclusion
Timeout patterns function as observable markers that align with second-half line movements through documented statistical relationships and situational context. Aggregated data across seasons confirms that timing, frequency, and accompanying factors such as score differential and rest status refine the strength of these connections. Continued collection of play-by-play records supports ongoing refinement of these indicators for those monitoring NBA markets.