Shifts in NBA Star Minutes Shape Late-Season Prop and Spread Markets
Ellis Richter · Aug 20, 2026
Shifts in NBA Star Minutes Shape Late-Season Prop and Spread Markets
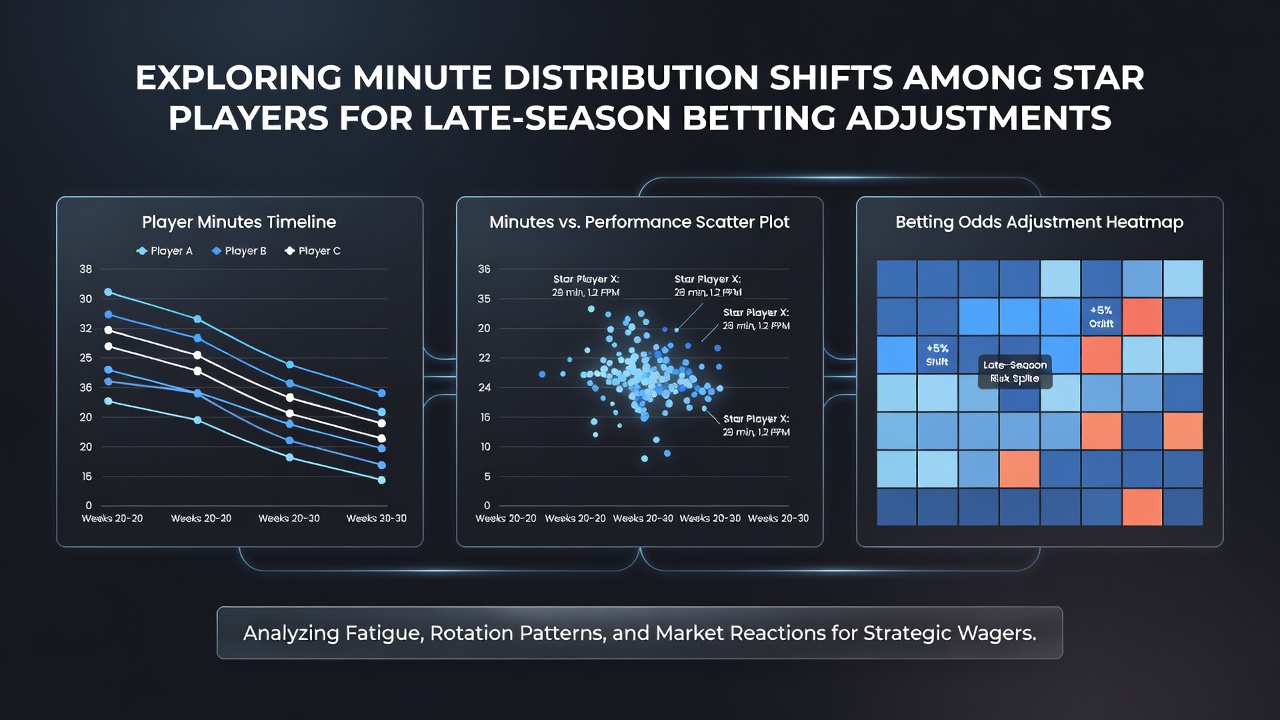
Star players in the NBA see their minute allocations change noticeably once the regular season enters its final six weeks, and these adjustments directly affect player prop lines along with team totals and spreads. Data from official league tracking shows that teams begin to cap minutes for high-usage stars around the 32-minute mark instead of the 36-to-38 range that dominated earlier months, while load-management protocols accelerate during back-to-back sets and after playoff qualification becomes mathematically secure.
Patterns in Playing-Time Redistribution
Researchers who examined five seasons of NBA player-tracking files found that the average starter on a projected playoff squad loses 4.2 minutes per game between March 1 and April 10, yet bench rotation players often absorb 3.8 additional minutes during the same window. This redistribution occurs because coaches prioritize rest for veterans and increased development for younger contributors ahead of postseason matchups. Consequently, fantasy and betting models that rely on season-long averages begin to diverge from actual outcomes once these minute reductions take effect.
Teams that already hold playoff positioning post the largest drops, whereas squads still fighting for seeding maintain steadier distributions until the final ten days. One study of 2024-2025 data revealed that Eastern Conference clubs with double-digit leads in the standings reduced star minutes by 5.7 per contest on average, while Western Conference teams within three games of a play-in spot held minutes within one minute of prior averages. Bettors who monitor conference standings and remaining schedule strength therefore gain an edge when adjusting prop projections.
Impact on Specific Betting Markets
Player prop lines for points, rebounds, and assists move once oddsmakers incorporate the new minute realities, yet the adjustment window often lasts two to three games because early lines still reference full-season samples. Point guards and wings who drop below 30 minutes see their points prop totals decline by 4.1 on average, while centers experience a smaller 2.3-point reduction because their efficiency holds steadier at lower usage rates. Rebound props shift more dramatically for power forwards and centers who lose minutes, with totals falling 1.8 per game on average according to league-wide aggregates.
Case Examples from Recent Campaigns
During the 2025 stretch run, a Western Conference power forward saw his minutes fall from 34.8 to 28.2 after his team clinched a top-four seed, and his rebound prop line moved from 9.5 to 7.5 within four days. Bettors who tracked the coaching staff's public comments about rest and cross-referenced injury reports captured value on the unders before the market fully corrected. Similarly, an Eastern Conference guard maintained 35-plus minutes because his club remained in the play-in race, and his assist prop stayed elevated even as surrounding teammates received reduced roles.
Statistical Tools That Quantify the Shifts
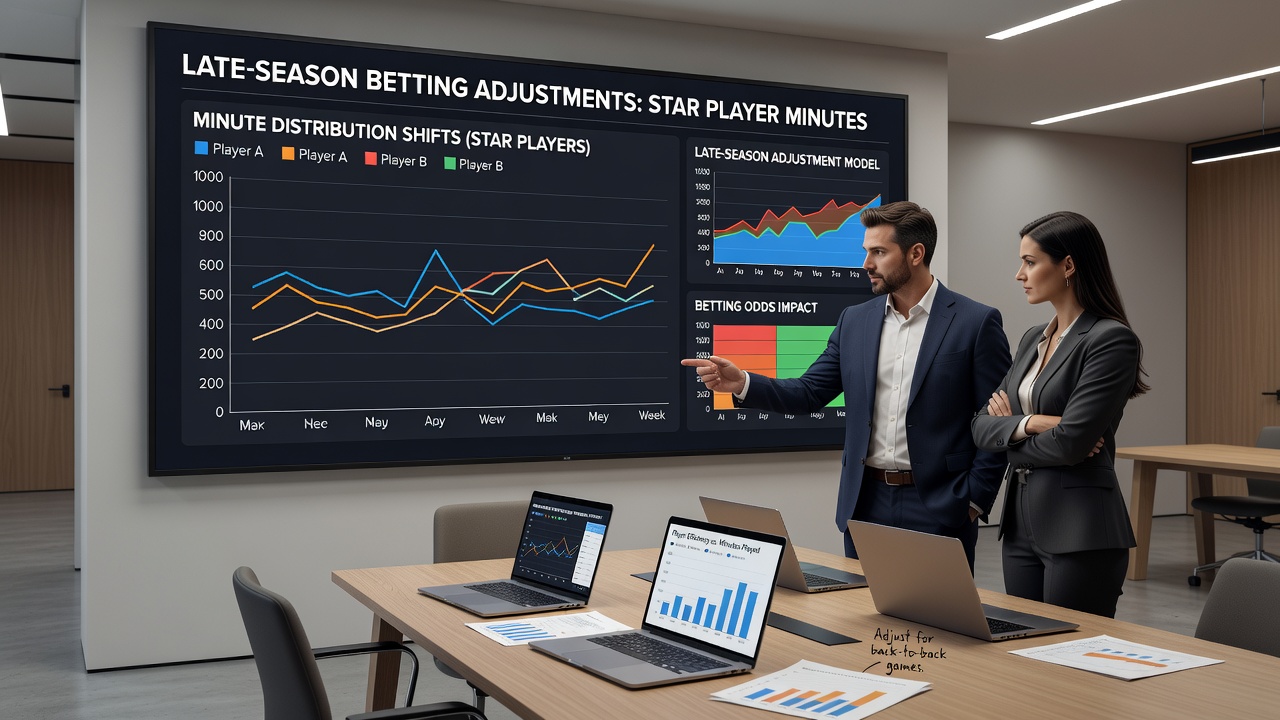
Advanced metrics such as real-plus-minus and usage-rate differentials help isolate the effect of minute changes from other variables like opponent defensive rating. When a star's usage rate drops below 22 percent alongside a minute reduction, assist props tend to compress more than points props because fewer touches occur in the half-court offense. Data aggregators that publish nightly minute projections allow bettors to update models before lines move, and several sportsbooks now publish their own projected minute ranges derived from similar inputs.
External research from the NBA's official tracking database supplies granular on-off splits that reveal how team efficiency changes when stars sit for extra rest periods. Complementary analysis from the Australian Institute of Sport's performance unit has examined comparable load-management patterns in other professional leagues, confirming that late-season minute cuts produce consistent statistical compression across multiple sports.
Integrating Schedule and Injury Context
Back-to-back games and three-in-four-night stretches amplify minute reductions, especially when travel distance exceeds 1,000 miles. Injury reports released the morning of tip-off often confirm the planned reductions, yet sharp bettors identify the pattern one or two days earlier by cross-referencing coaching quotes and practice participation logs. As August 2026 approaches, teams will begin internal reviews of the prior season's minute-management protocols, and those reviews frequently surface in media reports that preview the 2026-2027 campaign.
Conclusion
Minute-distribution shifts among star players create measurable edges in late-season NBA betting markets when analysts combine official tracking data, conference standings context, and schedule density. Observers who update projections in real time rather than relying on season-long baselines capture value before sportsbooks fully recalibrate. The same patterns are expected to recur each spring, giving market participants a repeatable framework for adjusting props, spreads, and totals during the final stretch of the regular season.