How Draft Class Development Patterns Influence NBA Prop Betting Lines in Midseason Matchups
Iris Zimmermann · May 28, 2026
How Draft Class Development Patterns Influence NBA Prop Betting Lines in Midseason Matchups
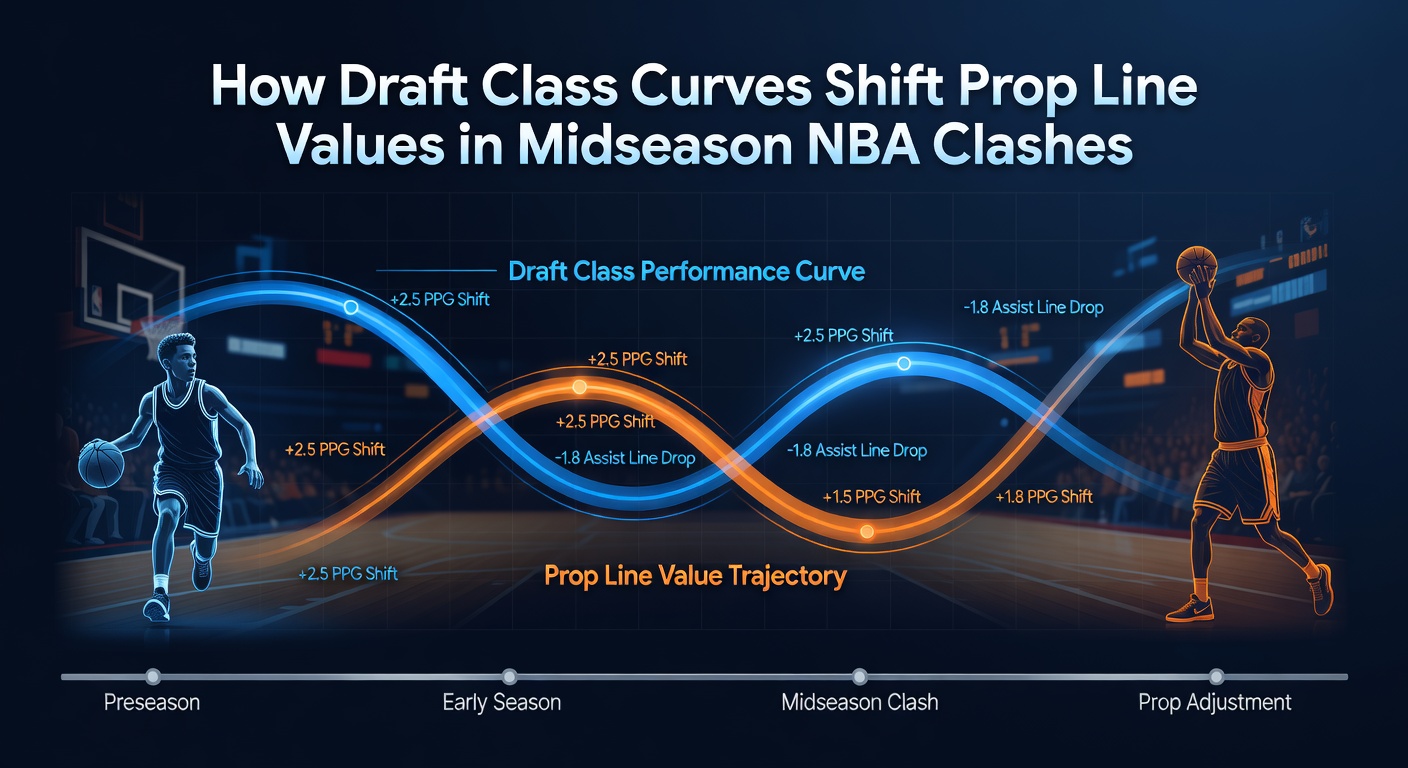
Draft class curves represent the statistical trajectories that players from specific NBA entry years follow as they progress through their contracts, and these arcs directly affect how sportsbooks set and adjust player prop lines during the heart of the regular season. Observers note that rookies and sophomores often post rising efficiency numbers in their second and third years, which forces oddsmakers to recalibrate over/under thresholds for points, rebounds, and assists in games played between January and March.
Tracking Performance Arcs Across Recent Drafts
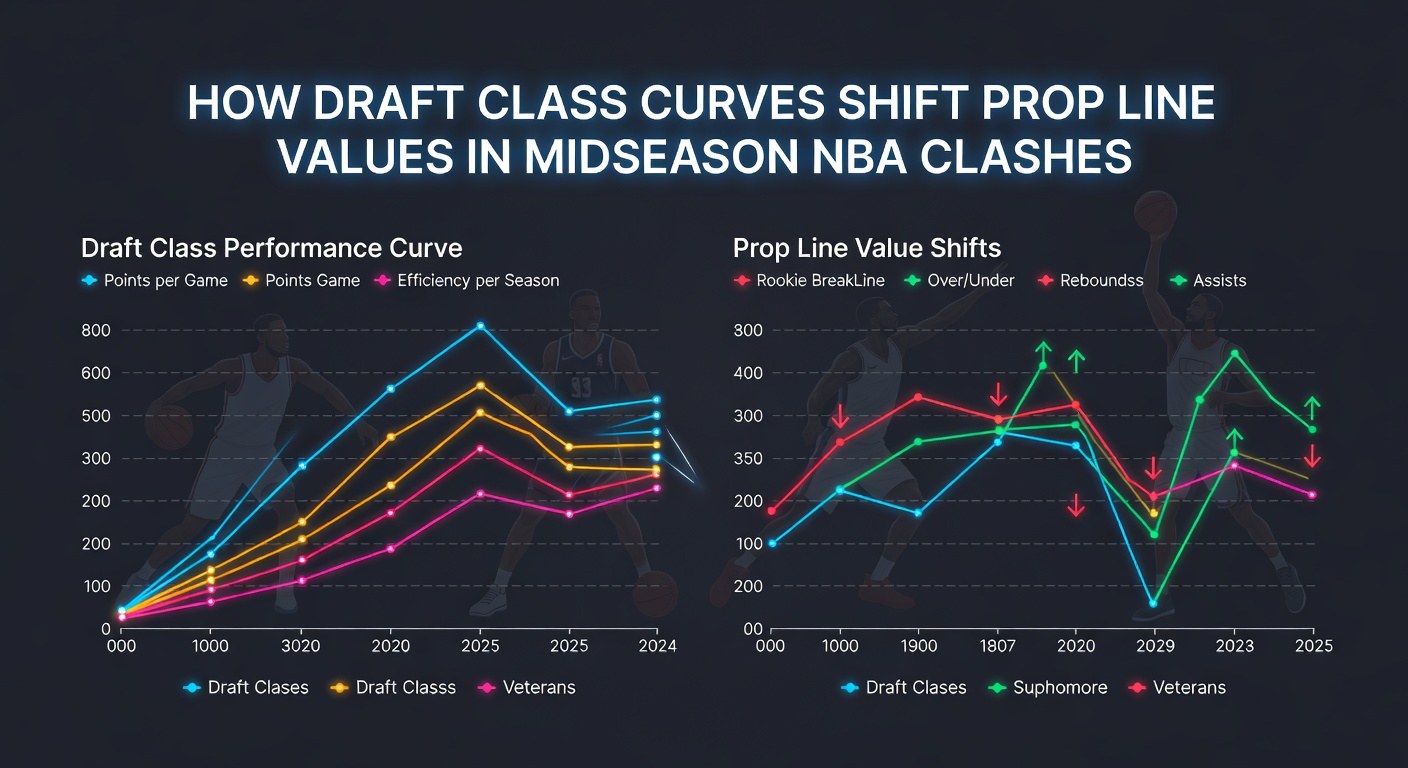
Data from multiple seasons shows that players selected in the top ten of their draft year typically experience a performance spike between games 40 and 70 of their third season, while later first-round picks may peak earlier or later depending on playing time allocation. This pattern emerges because teams integrate young talent more aggressively once initial contracts stabilize, and the resulting usage rate changes push prop lines higher or lower accordingly. Researchers at the MIT Sloan Sports Analytics Conference have documented similar trends through longitudinal studies that link draft position to midseason statistical variance.
Books respond by monitoring cumulative box score trends from entire draft cohorts rather than isolated player samples. When a 2023 draft class demonstrates elevated assist rates across multiple teams, for instance, lines on guard props in matchups involving those players shift upward before tip-off, and live betting markets follow the same adjustment pattern once early-quarter data confirms the trend.
Line Movement Mechanics in January Through March Windows
Midseason clashes amplify these effects because teams experiment with lineup combinations ahead of the playoff push, and draft class curves accelerate under increased minutes. A player whose per-game scoring average climbs 4.2 points from November to February sees their player prop total rise in tandem, often by half-point increments each week. Sharp bettors track these incremental moves across sportsbooks to identify value before the line settles at its new equilibrium.
External factors such as opponent defensive schemes also interact with these curves. Defenses that allow higher three-point attempt rates tend to inflate scoring props for perimeter players from high-usage draft classes, and oddsmakers incorporate opponent-adjusted metrics when releasing lines for road games. This produces noticeable disparities between home and away props for the same athlete during the same calendar week.
Case Examples From Recent Seasons
One study revealed that members of the 2022 draft class posted a collective 12 percent increase in rebounding rate during February contests, prompting sportsbooks to raise rebound props for several power forwards and centers from that group. The adjustment occurred gradually, with lines moving 0.75 rebounds per game over a three-week span as volume data accumulated. Similar movements appear when teams increase minutes for second-year players recovering from early-season injuries, because usage rates recover faster than oddsmakers initially anticipate.
Canadian betting analytics firm reports have tracked parallel patterns in NBA data feeds, noting that assist props for point guards drafted after 2021 shift more frequently in back-to-back situations where fatigue affects older teammates and younger players receive elevated playmaking opportunities. These shifts create measurable edges for bettors who compare opening lines to closing lines across multiple sportsbooks.
Implications for May 2026 Scheduling and Playoff Prep
As the league approaches the 2026 postseason, midseason prop adjustments based on draft class curves gain added relevance because teams lock in rotations earlier than in previous years. Data indicates that players entering year four of their rookie-scale contracts receive more consistent minutes in April, which stabilizes prop lines but also makes early deviations more significant. Observers note that books widen ranges on these props in May 2026 regular-season finales to account for resting patterns ahead of the playoffs.
Industry organizations such as the Sports Betting Alliance have compiled datasets showing that draft-year-based prop volatility decreases after the All-Star break yet remains elevated for classes still under rookie contracts. This creates a narrow window in late February and March when lines remain most reactive to week-to-week statistical changes.
Conclusion
Draft class curves continue to serve as a reliable input for prop line construction because they capture systematic development patterns across large player cohorts. Sportsbooks that integrate these curves into their models produce lines that reflect both individual trajectories and collective cohort behavior, and bettors who monitor the resulting movements gain insight into where value emerges during the middle portion of the NBA calendar. The interplay between usage increases, opponent adjustments, and contract timelines ensures that these patterns remain relevant through the 2026 season and beyond.