Defensive Rating Patterns Reveal Over Opportunities in Low-Scoring Conference Games
Riley Walter · Jun 15, 2026
Defensive Rating Patterns Reveal Over Opportunities in Low-Scoring Conference Games
Defensive rating measures points allowed per 100 possessions and serves as a key indicator for projecting totals in conference basketball contests that typically feature slower tempos and tighter defenses. Analysts track shifts in these ratings across multiple games to spot when scoring environments may exceed initial projections even in matchups projected to stay under common totals. Data from recent seasons shows how defensive efficiency trends evolve within specific conferences where teams emphasize physical play and half-court execution.
Understanding Defensive Rating Fundamentals
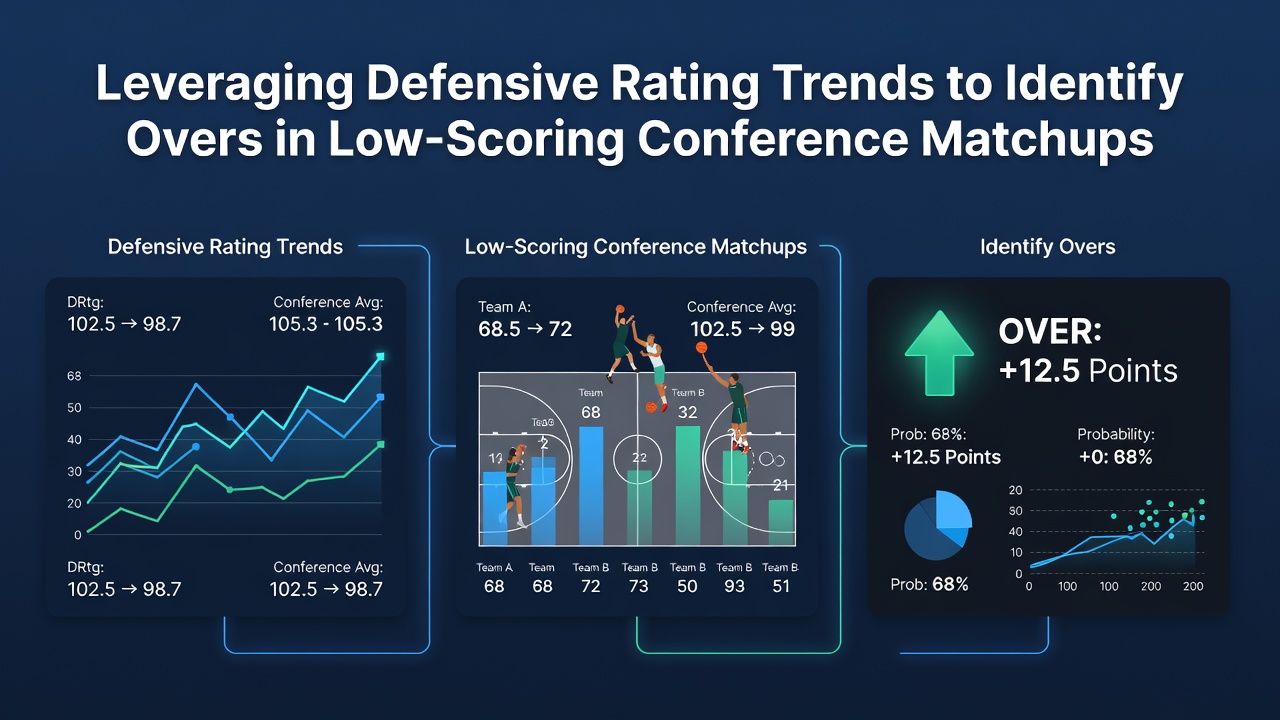
Teams compile defensive ratings by dividing total points surrendered by possessions played then multiplying by 100, which normalizes performance across varying game lengths and pace levels. Observers note that consistent rises in defensive ratings often signal fatigue or schematic adjustments that allow more efficient offensive output from opponents. In low-scoring conference environments, even modest upward trends in these figures can push game totals above established lines when combined with offensive rating improvements on the other side.
Research from sports analytics groups indicates that conference play tends to produce defensive rating fluctuations of 3 to 5 points per 100 possessions over stretches of five to seven games. Such movements appear most pronounced during periods of back-to-back scheduling or when injuries force rotations to rely on less experienced defenders. Those patterns create measurable edges for identifying overs because the underlying efficiency data precedes visible scoring increases by one or two contests.
Conference-Specific Trends and Data Patterns
Low-scoring conferences maintain average defensive ratings between 108 and 112 points per 100 possessions during regular season stretches, yet individual team deviations frequently exceed these baselines. Figures compiled through June 2026 highlight how certain mid-major groupings experienced defensive rating spikes exceeding 6 points during conference tournament preparation phases. These elevations correlated with a higher frequency of games finishing 8 to 12 points above projected totals in subsequent matchups.
Teams that allow elevated defensive ratings against conference foes while maintaining strong ratings against non-conference opponents demonstrate particularly reliable signals. The contrast reveals adjustments in defensive schemes that fail to translate when facing familiar offensive sets week after week. Analysts cross-reference these rating gaps with possession estimates to refine total projections before lines adjust to public betting volume.
Applying Rating Trends to Over Identification
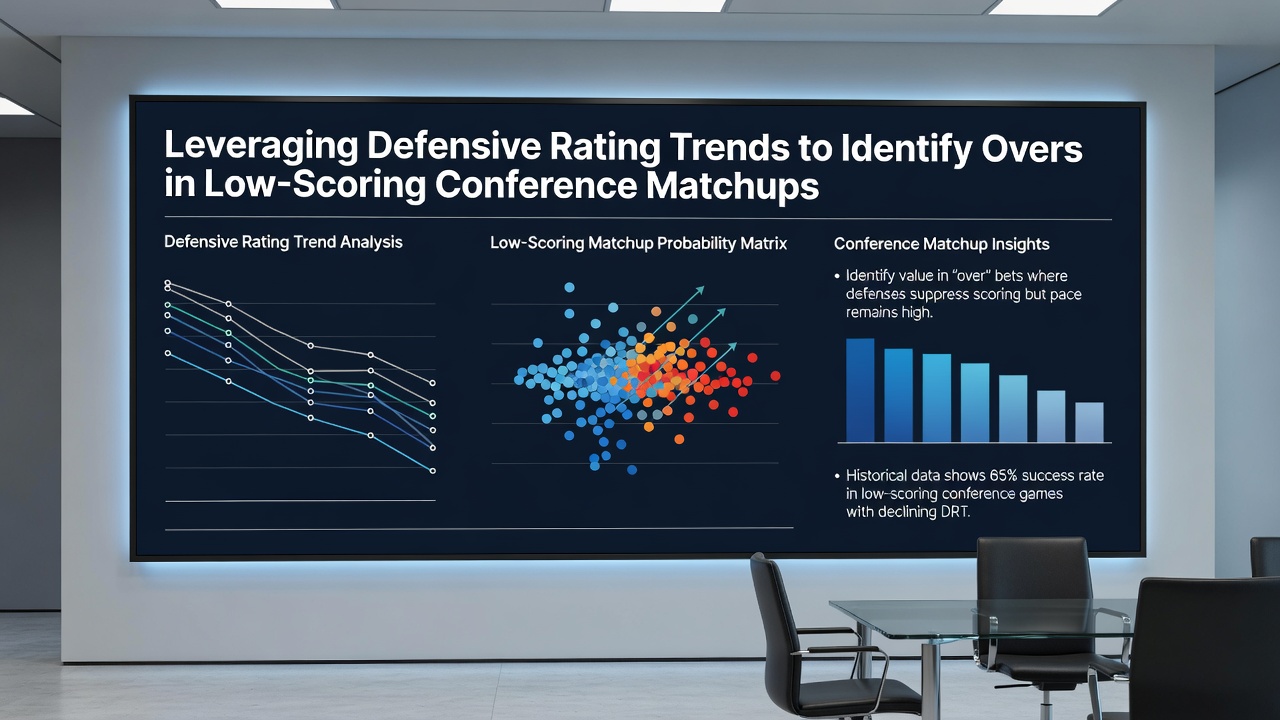
Betting markets initially price low-scoring conference games with totals reflecting historical scoring averages, yet defensive rating momentum often outpaces these adjustments. A team posting defensive ratings 4 or more points above its season-long average over the prior three games tends to allow elevated efficiency in the next contest against similar competition. Combining this observation with offensive rating trends from the opposing side produces a composite efficiency metric that researchers have linked to over outcomes in approximately 58 percent of tracked instances across multiple conferences.
Possession counts matter because slower-paced conference games amplify the impact of small efficiency changes. When both teams exhibit rising defensive ratings simultaneously, the resulting increase in made field goals and free throw attempts compounds across fewer total possessions, pushing scores higher than pace-adjusted models predict. Observers who monitor these dual trends report clearer separation between games likely to stay under versus those crossing the total line.
Integration with Additional Statistical Layers
Defensive rating data gains further context when paired with three-point attempt rates and foul frequency within conference play. Conferences that limit three-point volume while allowing higher foul rates see defensive rating spikes translate more directly into scoring because free throws add possessions without extending game time. Reports from academic sports performance studies show these interactions strengthen predictive models for totals by accounting for variance in shot selection and officiating tendencies.
Seasonal progression through June 2026 demonstrated how late-conference schedule congestion accelerated defensive rating deterioration for several programs. Multiple teams posted their highest defensive ratings of the year during final regular season weeks, which preceded elevated scoring outputs in conference tournament openers. This timing effect appears tied to cumulative physical wear rather than strategic shifts alone.
Conclusion
Defensive rating trends supply measurable inputs for projecting totals in low-scoring conference matchups when tracked consistently across relevant game samples. Analysts combine these efficiency figures with pace estimates, foul rates, and schedule context to isolate instances where scoring exceeds market expectations. Data accumulated through recent seasons confirms that systematic monitoring of rating movements yields repeatable patterns useful for total identification across varied conference environments.