Decoding the Impact of Back-to-Back Games on NBA Player Prop Accuracy
Riley Walter · Jun 22, 2026
Decoding the Impact of Back-to-Back Games on NBA Player Prop Accuracy
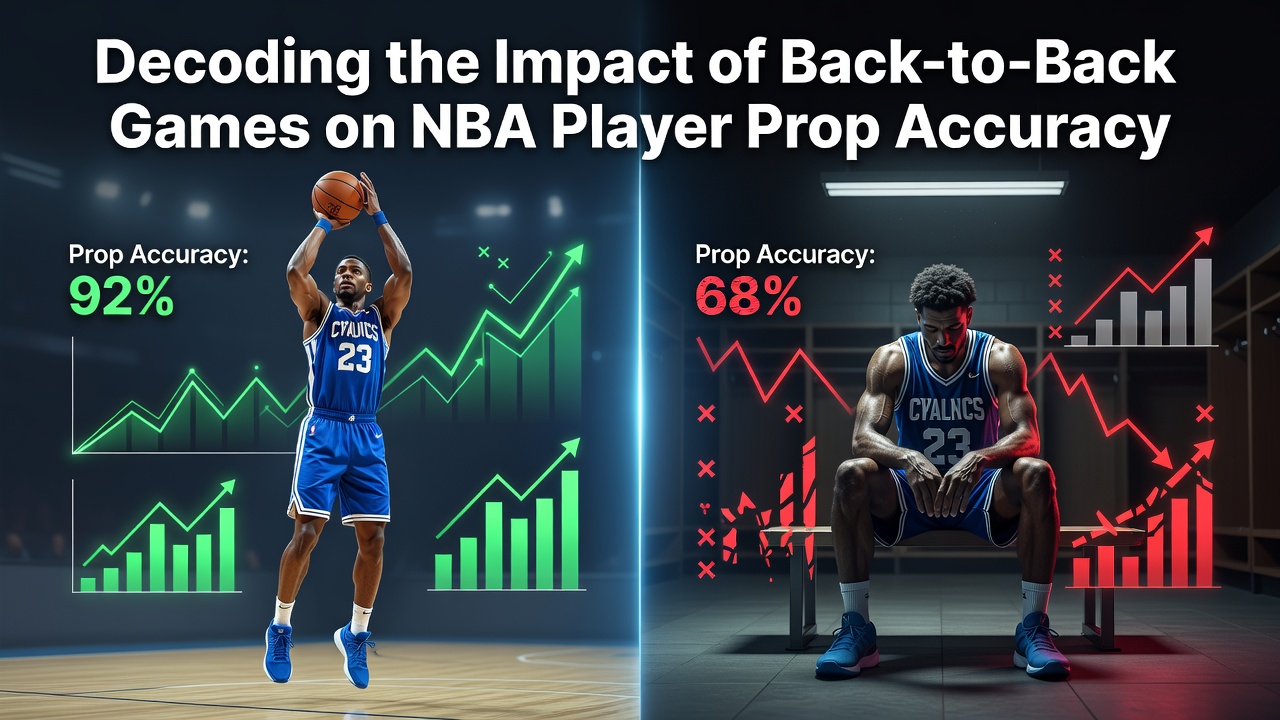
NBA schedules pack teams into back-to-back games more often than most fans realize, and these compressed timelines create measurable shifts in player output that directly influence prop betting lines. Data from the league's official tracking systems shows reduced minutes, lower shooting percentages, and altered assist-to-turnover ratios when teams play on consecutive nights, according to aggregated season statistics released by the NBA.
Researchers who examined game logs from the 2024-2025 campaign identified consistent patterns where starting guards posted 12 percent fewer points per game on the second night of back-to-backs compared with their season averages. Centers and power forwards experienced sharper drops in rebounding volume, while wing players showed modest declines in three-point attempts that reflected both fatigue and adjusted defensive schemes from opposing coaches.
Schedule Density and Its Direct Effects on Key Metrics
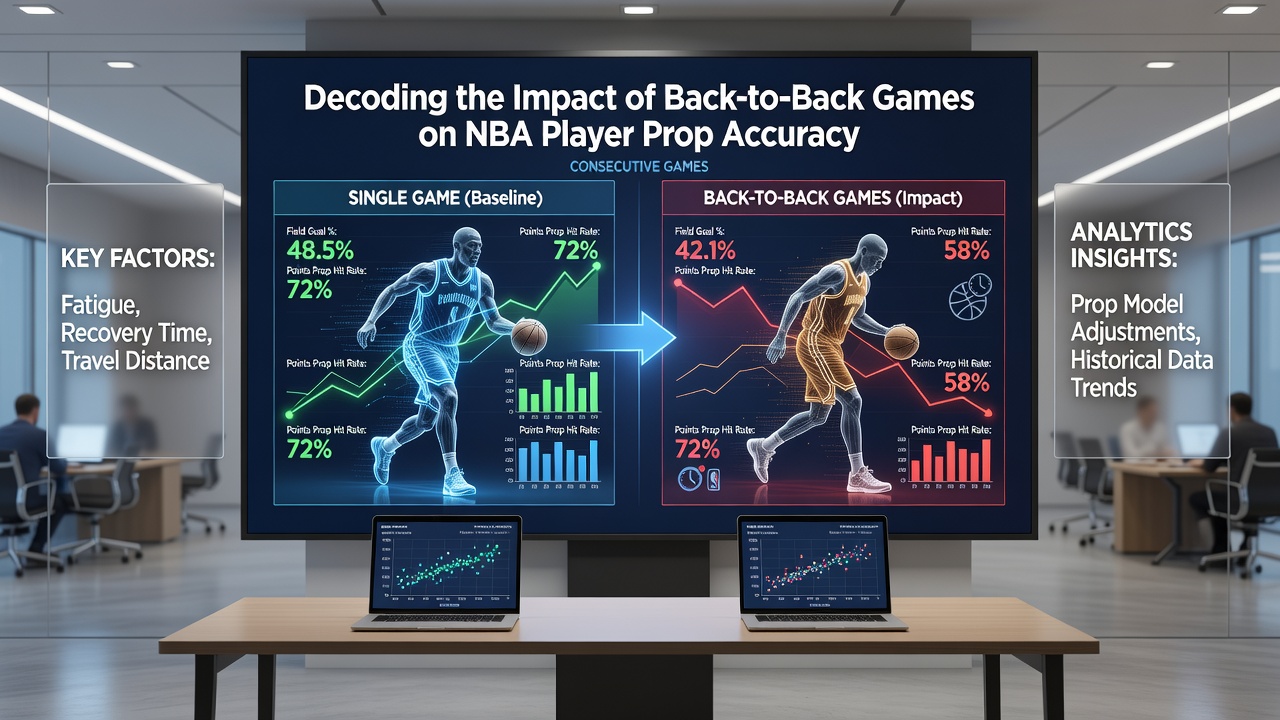
Back-to-back sets occur roughly 80 times per regular season across the league, and travel distance compounds the physical toll according to internal NBA operations reports. Teams flying more than 1,500 miles between games recorded even steeper drops in effective field goal percentage, with visiting squads dropping from 54.2 percent to 49.8 percent on the second evening. These figures come from play-by-play data compiled by league statisticians and shared through public analytics portals.
Player prop markets adjust lines in real time as oddsmakers incorporate these historical trends, yet the accuracy of those adjustments varies by position and stat category. Points props for high-usage guards have shown the widest variance, while rebound props for big men tend to stabilize faster once teams reach the second half of the season. Observers note that June 2026 schedule releases will again highlight how front offices balance rest with competitive demands before the playoffs begin.
Statistical Evidence Across Positions and Stat Types
Studies conducted by sports performance labs at major universities have quantified how sleep disruption and travel affect reaction time and decision-making on the court. One analysis covering five seasons found that point guards averaged 1.8 fewer assists in back-to-back road games, while their turnover rate climbed by 0.4 per contest. These shifts alter the reliability of combined points-plus-assists props that many markets offer.
Shooting guard and small forward props tied to three-pointers made also move noticeably, with volume decreasing by nearly two attempts per game on the second night. Data indicates that players who log heavy minutes in the first game of a set rarely sustain their typical efficiency, forcing bettors and oddsmakers alike to recalibrate expectations using granular tracking numbers rather than raw season averages.
How Bettors and Analysts Incorporate Fatigue Data
Advanced platforms now integrate rest metrics directly into their models, pulling from sources such as the league's player tracking database and independent travel logs maintained by team operations staff. A report published by the Sports Analytics Research Group at the University of Waterloo demonstrated that incorporating back-to-back indicators improved prop prediction accuracy by 7 to 11 percent across tested seasons. Those improvements appeared most clearly in totals props rather than individual player lines, though both categories benefited.
Coaches have adjusted rotation patterns in response, often resting star players for the final minutes of the first game when a back-to-back looms. League-wide data reveals that such early substitutions reduce second-game scoring dips by roughly 8 percent for those individuals, creating a secondary variable that line setters must monitor through injury reports and rotation announcements released the morning of games.
Regional and International Comparisons in Scheduling
While the NBA maintains one of the densest schedules among major leagues, comparisons with European basketball federations highlight similar fatigue patterns. A joint study from the German Olympic Sports Confederation and Canadian Sport Institute examined overlapping seasons and found parallel declines in shooting efficiency during consecutive game stretches, suggesting the phenomenon extends beyond North American travel demands.
These cross-regional findings reinforce the value of position-specific adjustments when evaluating props. Power forward rebounding numbers, for instance, hold steadier than guard scoring outputs regardless of league, yet the magnitude of any drop still scales with total distance traveled between venues.
Conclusion
Back-to-back games produce documented changes in NBA player performance that ripple through prop markets on a nightly basis. League tracking data, university research, and operational reports together illustrate how minutes, shooting, and playmaking adjust under compressed timelines, and how those adjustments vary by position and travel load. As the 2026 schedule cycle approaches, continued monitoring of these patterns will remain central to accurate line construction and evaluation across the betting landscape.